This is Part III in a multi-part series.
In Part I – We introduced the concept of analytically measuring the performance of delivery teams.
In Part II – We talked about how Agile practices enhance our ability to measure more accurately and more often.
In this part, we’ll talk about “Which Dimensions are Most Important to Measure”
As we’ve stated in the previous sections, we could certainly (and do) measure lots of things in a project. What’s most important though is knowing what are the most important measurements that will give us a meaningful set of metrics on which to rate our sense of progress on a project, or to compare various delivery channels / teams / vendors / approaches.
To accomplish this, we start with a black box ‘value statement’ of an IT delivery organization. At the highest level, and IT organization is a ‘factory’. We put requirements in and get working software out. Taking this model a little further, consider that our ‘factory’ is actually composed of three different delivery channels or assembly lines. Each delivery channel takes in a set of requirements, and produces working software (and production metrics) that is then integrated into a production environment (which also produces some useful metrics on a day to day basis on how each of those software ‘products’ are performing once in production.
If I keep the complexity out of the model, and assume that I can normalize all my metrics, then these metrics should be able to tell me how each delivery channel is doing compared to one another or how they have improved or regressed over time.
So what are these metrics? Well to start, let’s break these metrics up into three dimensions:
Predictability – A measure of how close estimates come to actuals with regard to both delivery costs and deadlines. A key variable in measuring predictability is lead time. Specifically, what is the measured level of predictability at various points in the project lifecycle. Predictability should increase as quickly as possible as lead time shortens.
Quality – A collection of measures that ensure overall integrity of the delivered code is tracking properly to a base-lined production level acceptance; both from an operational support level as well as a business user level.
Productivity – Measurements that assess the amount of work completed as a function of cost. These metrics can be used to compare two different teams (such as a pure onshore vs a multi-sourced team) to assess the efficiency of delivery using either approach – assuming predictability and quality are the same.
Let’s also realize that these dimensions are inter-dependent. Over emphasis of one can often lead to a decline in another. But we’re going to save that interdependence for a little later in this paper and tackle these one by one first.
Predictability
Predictability isn’t just about how close you can come to your measured estimates. It’s also about when you gave that estimate. Consider the following two scenarios – each that represents a 15% slip (inaccuracy to the original estimate) against a 9 month project:
Scenario 1: The 15% slip occurs a few weeks into the project when it’s discovered that a new technology (through ‘spiking’ / ‘proto-typing’) is discovered to have some significant short-comings in its’ ability to delivery as it’s been advertised. In this case a mitigation plan can be put in place, re-architecture can be done and perhaps even some of that 15% slip can be mitigated through trading off certain features or function – managing change early with the business.
Scenario 2: The 15% slip occurs late in the project (say the last 2 weeks before go live) when it’s discovered that the new technology platform doesn’t scale properly. The late occurrence of this was because performance testing was not scheduled until the last few weeks of the project. In this case, the same 6 week slip is going to have much more serious consequences to a wider range of stake-holders that must now react to this change.
As contrived as the above examples appear – scenario 2 actually occurs more often that it should. And in fact, while both projects missed their go-live date by 6 weeks, the very different impacts of that slip demonstrate how important lead time is as a measurement of predictability.
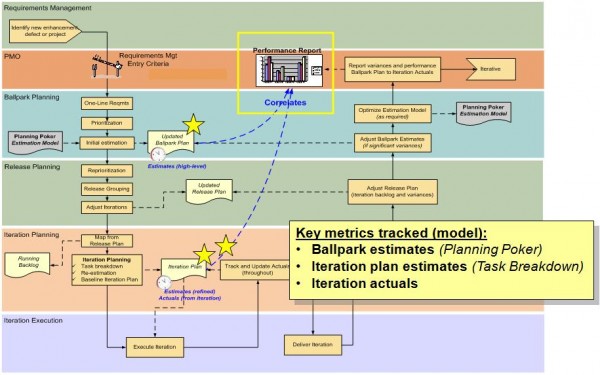
Obviously, the best way to avoid scenario 2 is to measure sooner and more often throughout the entire lifecycle. The process flow diagram below is from an actual Agile project. The ‘stars’ capture the places where estimates are captured.
Ballpark estimates represent the first level estimates for the project. They are used to create the overall release plan and are typically done (as a matter of need) without having fully detailed requirements.
Once the project is underway, estimates done at the start of each iteration provide another sanity check to the original ballpark estimate. Rather than being top down estimates, iteration estimates are generated through task decomposition and bottom estimation of those tasks at a feature level (more on this in the productivity section).
Finally, iteration actuals demonstrate the final true measure of predictability, both to the original estimates as well as to the iteration estimates. Because this occurs every one to three weeks in an Agile project, the chance for early course correction (based on incorrect early assumptions) is raised and the chance that a ‘scenario 2’ will occur is decreased.
Although an Agile methodology was used here, the more important concept here is measure early and measure often during a project. And the more we can tie these measurements to working code, the more faith we can put in predicting how the project will turn out based on those metrics.
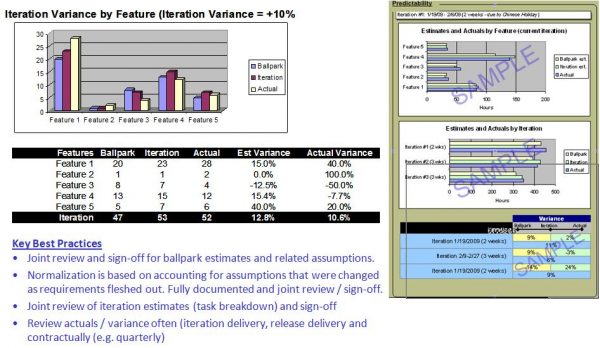
So what might a dashboard of such metrics look like? Take a while to look at the actual dashboard example provided (and scrubbed) below. How useful might some of the insights gained through these metrics be in establishing how well a development team was performing with regard to predictability?
In Part IV and V we’ll look at the other two dimensions of performance; Quality and Productivity.


