
Key Points from Interview with Frederick Vallaeys
- ValueTrack is the AdWords feature that allows advertisers to tag their URLs with parameters. The resulting URL can then be used within the advertiser's own tracking systems.
- Too many advertisers settle for global level reporting and do not look further. Even if your top level metrics are OK, you can still get great gains in overall campaign performance by digging into more detailed reports.
- Segmentation is the biggest power reporting feature that is not used by many advertisers.
- Types of segmentation can include times of day, days of week, device type, social signals, and more.
- (Fred): “… no matter from which channel the +1 comes in, it all aggregates at the URL level.”
- (Fred): “In the social segmentation, you can actually see what the impact is of having each of these different variations.”
- You can run multiple segments via the downloadable reports or the API.
- (Fred): “… at the end of 2011, half of American consumers had a Smartphone in their pocket.”
- Google has a site at howtogomo.com that you can use to see how your site renders on a mobile device.
- (Fred): “Google Analytics offers multichannel funnels, and what these allow you to do is see what touch points people have with your online campaigns before a conversion happens.”
- (Fred): “One tool that we have is the AdWords Campaign Experiments. That’s a great way for an advertiser to explore how to improve their ROI. They can send 10%, 20%, 30%, whatever percentage they want of their traffic to that experiment.”
- (Fred): These (new ad formats) were a big thing for us in 2011, and will continue to be a big thing in 2012.
- The Bid Simulator tool will show you what to expect for different types of increases (or decreases) in bids.
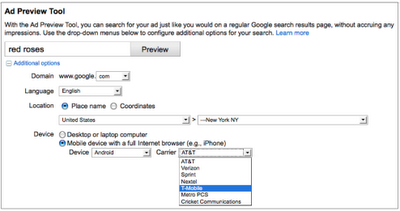
- The Ad Preview Tool allows you to see whether or not your ads are running. It also allows you to test geotargeting in areas other than your current location, or various types of mobile devices.
- Top of Page bid estimates show you what your bid would have to be to show up in the space above the organic results.
- Impression share is a way to see what percentage of the time your ads are running. Tuning your campaign to increase impression share can be one of the best ways to get additional traffic.
- Google Analytics is planning to expand its social reporting to include more than just the data from Google owned properties – i.e. data such as Facebook Likes.
Full Interview Transcript
Eric Enge: Can you tell me some great power reporting features in the AdWords interface that people rarely use?
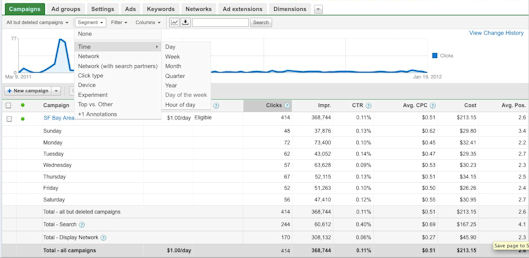
Frederick Vallaeys: When you look at AdWords, there are three high-level types of reports that we make available for our customers. You can go into the campaign management interface and pull reports right there in your campaigns. Then, we also have Google Analytics which goes a little bit deeper into some of the data, for example, with real-time reports, social reports and cross-channel reports that look at how ALL your campaigns are contributing to your success and your ROI. The third one is making reporting available for people who prefer using APIs or building their own reporting systems using our URL tagging feature, ValueTrack.
That is a way for us to attach some additional information to each click that comes to your website so that your own reporting software can capture that and then process it. If you look specifically at what is available in the AdWords interface, it's really gotten very sophisticated in terms of segmentation. And, I think one of the biggest mistakes that advertisers make is they look at their reports at too high a level.
There are probably all of these micro-segments within your campaign where things are performing fantastically well …
There are probably all of these micro-segments within your campaign where things are performing fantastically well, but you don't know it because you looked at things are an aggregated level. On the flip side you also have elements of your campaign that just aren’t working well. Examples of segments that you could be looking at are the specific time of the day, and the specific day of the week. You may for some reason find people just aren’t buying your product at certain times of day or days of the week.
 |
Eric Enge: What are some of the other segments you offer have?
Frederick Vallaeys: One of my favorite ones is the social segments. When we introduced Google+, part of that was the +1 button, and now the +1 button will show up next to ads. +1s are being collected from the ads, from the organic results, but also from having the +1 button on your own website.
… no matter from which channel the +1 comes in, it all aggregates at the URL level …
Eric Enge: The +1 is associated with a web page, and not the ad or organic results, isn't that right?
Frederick Vallaeys: Exactly, no matter from which channel the +1 comes in, it all aggregates at the URL level, and will show up in any channel where the consumer is then looking for your business. As an advertiser, when you put the +1 button on your site, you start getting some +1s, and now when somebody is looking for your business or your service, they see your ad as you would have seen it in the past but now there is also a count of +1s next to it.
It might indicate that Eric and five other friends have +1d this page, or, you have the more generic one where it just says 500 people have +1d this. In the social segmentation, you can actually see what the impact is of having each of these different variations.
If you knew that this could drive a lot more clicks, a lot more conversions, then you could make a bit of an effort within your company to get more +1s for those specific URLs …
As an advertiser, what you can start to see is that probably the most powerful results are the ones that have the personal recommendations, and you could start finding some URLs on your sites in your campaigns that you are advertising for, that don’t have a lot of these personal recommendations. If you knew that this could drive a lot more clicks, a lot more conversions, then you could make a bit of an effort within your company to get more +1s for those specific URLs that you have in your ad that need more of the personal +1 recommendations.
Eric Enge: Very cool. What are the sub-flavors that go into the social reports then?
Frederick Vallaeys: When we moved all of reporting into the campaign management interface, the whole notion that we had was to make it really easy for people to immediately act on the information that we show them. Just imagine your traditional campaign management page, it's down to the ad group level, you can see the results for that. And any time horizon of course that you want as well. Ryan, is there anyway to run multiple segments at the same time?
Ryan:Ryan Voccola: Not in the UI, but you can do it with a downloaded report, or with the API where you would have to add on additional segments that will come out in the CSV export.
Frederick Vallaeys: So you can see how social is effecting your performance, but then correlate that to how certain times of day, or the day of the week, is also impacting your results. That’s where you really get small micro segments where you could start figuring out some pretty interesting things. I think most advertisers will stay at that first level of segmentation, because that’s really going to give you some pretty good returns and that’s also where they have enough data to make statistically sound decisions.
Eric Enge: You can also segment by device, right?
… at the end of 2011, half of American consumers had a Smartphone in their pocket.
Frederick Vallaeys: Yes, that’s a huge one right now because at the end of 2011, half of American consumers had a Smartphone in their pocket. There is a lot of web usage occurring on these mobile devices. One interesting thing we see is that mobile device usage really spikes early in the morning and late at night, so literally the first thing people do in the morning is take out their mobile devices and check their email or research something and it is also the last thing they do before they go to sleep.
As that behavior becomes more common and the usage numbers go up dramatically, it's really important for an advertiser to look at how they are performing differently on these different devices. Your performance could vary based on whether or not searchers are on a Smartphone, tablet device, desktop or laptop. Perhaps you should make a mobile website to drive up your conversions.
One really cool tool that we launched a little while ago that maybe not many people know about is howtogomo.com. On that site we do an evaluation of people's websites and how they would render on a mobile device. It’s a really easy for someone to see if somebody came to the site from a mobile phone, would it even make sense to them, would they be able to click the links or are they too small, or how does the page render on these smaller screen devices.
Eric Enge: Have you seen examples of people where there are drastic differences in time of day in terms of conversion rates?
Frederick Vallaeys: That is a little bit industry specific for the most part, but in the travel space in the morning people tend do a lot of research, and then during their lunch break they call their spouse or significant other, and in the afternoon you might see a little bit more booking behavior. Obviously, you do have to be careful with this because those clicks and those visitors that were doing research may be just as important to getting the final conversion.
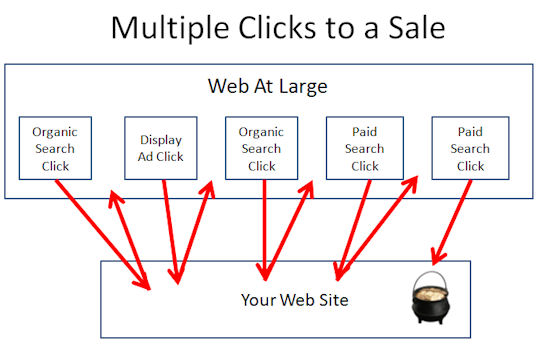
… a large percentage of conversions involve multiple clicks.

You probably look at Google Analytics to see the multiple steps that happen in your conversions. For the past 10 years, we have been looking at last click conversion in the industry, but a large percentage of conversions involve multiple clicks. It is important to understand the whole cycle for your site.
You might see really generic searches in the beginning, and then as people start to figure out exactly what they want, they get to a very specific search, and maybe the last search they do is a branded search. But all of the searches before that are often really important in convincing that customer that your company is a player in this space, someone they could trust to do business with.
Eric Enge: Can you talk about that a little bit about the problem of attribution?
Frederick Vallaeys: Google Analytics offers multichannel funnels, and what these allow you to do is see what touch points people have with your online campaigns before a conversion happens. Before we had this, we could tell you which keywords assisted in terms of search campaigns. This takes that one step further and tracks display campaigns and social media, so you can follow customers as they go through the funnel of conversion. Maybe you have three touch points through the display network and then you have two different searches happening, and then they bought something.
 |
Where it becomes challenging is you have to figure out how to assign value to each of these actions, as they are all involved in the conversion. You have to start modeling that for yourself, and you have to experiment with it to see what makes sense.
Eric Enge: For display ads you have this concept of a view through conversion, right?
Frederick Vallaeys: Yes, but what is more powerful here is we can start showing you how your typical person who converts saw your email marketing campaign first, then maybe they saw a tweet, then they saw your display ad three times, and then they did seven searches. You can actually see how all these events contribute to lead to that conversion. Maybe there are 500 people who took a path that was similar to that, and then there are other people who go directly to search because they know exactly what they want.
In the past, if you just looked at last click conversion, you would eliminate these keywords because they had never given you a conversion.
Now you have the data and now you can start figuring out why. If you were to cut out this list of keywords would that have an impact on your campaign? In the past, if you just looked at last click conversion, you would eliminate these keywords because they had never given you a conversion. That could be a big mistake, because maybe that is the keyword everybody always ends up searching, one search before they do the final one that at leads to the conversion. If you got rid of these searches, then people might not even realize your company existed or had this service available, and you wouldn’t get these last click conversion anymore.
Eric Enge: Unfortunately, there really is no science to how you attribute value across multiple clicks or views.
Frederick Vallaeys: Exactly, at some point maybe we will have some more insight into that, but for now the point is to give advertisers the data, and then they can start making decisions off of that.
Eric Enge: Can you talk about the experiments segmentation?
Frederick Vallaeys: One tool that we have is the AdWords Campaign Experiments. That’s a great way for an advertiser to explore how to improve their ROI. They can send 10%, 20%, 30%, whatever percentage they want of their traffic to that experiment. This shows up in your campaign reports, so you can see how the experiment compares to the rest of your campaign. If the experiment is not working well then turn it off and try a different variation.
 |
Eric Enge: It is an A/B test mode you can setup right within the interface.
Frederick Vallaeys: Exactly, in the past if you wanted to experiment, you would take two weeks of traffic and do one thing and then the next two weeks do something else. But the problem with that is, you are not comparing apples to apples because there might be outside factors during those two different periods that caused the numbers to change. With Campaign Experiments, you can actually split your traffic so all of the experiment is happening at the same time as the control and you get much more reliable data about how your changes impact your ROI.
Eric Enge: What about some of the new ad formats?
… we have seen tremendous success with advertisers who run Sitelinks.
Frederick Vallaeys: These were a big thing for us in 2011, and will continue to be a big thing in 2012. For example, we have seen tremendous success with advertisers who run Sitelinks. These are the additional portal links that you can have in addition to your headline in your ad. In the reports, you can segment on that so you can see how many clicks did you got from headline clicks and how many from your Sitelinks.
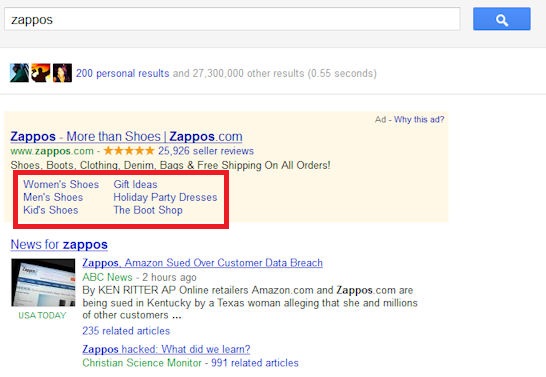 |
This will prove the value for the majority of advertisers and we have seen that these Sitelinks actually do work and have good click through rates and good conversion rates. You can start seeing how much of an impact this is causing and for those campaigns where you’re not using it, how much you are potentially losing as a result.
Eric Enge: Can you talk a bit about the bid simulator?
Frederick Vallaeys: It takes historical auction data and if you have bid x amount of dollars or y amount of dollars, where would you have come out in terms of the typical ad rank and what would that have done for your CTR and the number of clicks that you would’ve gotten. Instead of having to do an experiment and changing your bids around to get that data, we take whatever new number you put in and we run it against the past auction data, and model what would’ve happened in those cases. If you go from bidding a dollar for a click to a dollar fifty, is that going to give you a significant increase in the number of clicks.
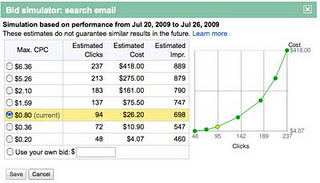 |
What you can figure out from this is your incremental cost per click. Incremental cost per click is a number, by the way, that too few advertisers understand and leverage. And basically, the notion of incremental cost per click is simple. It is the cost of the incremental clicks I get by bidding higher. When you know this number, you can figure if the additional clicks that resulted from an increased bid cost more than what it was worth or does it cost me less. The problem is that most people when they look at an AdWords account only look at the big picture.
If you look at an average, what you are not seeing is how did that increase in my bids change the cost of individual clicks. So on average, you might still be under your desired cost per click to meet your ROI goal, but what you are not seeing in that average is the fact that your last ten clicks, the additional ten clicks that you got by bidding higher, actually cost you $2 per click, higher than the $1.50 average, and maybe $1.50 is the maximum you can afford to spend for a click to still be profitable.
Eric Enge: Can you talk about the Ad Preview Tool?
Frederick Vallaeys: The Ad Preview Tool is lets you find and click on your ads in a test mode without paying for them. For example, you can see if the ad you have for people in Milwaukee is going to the right page, and what would someone from Milwaukee see. You put in your keywords and the location you want to test, you can see if your ad would’ve shown up in that case.
 |
Eric Enge: The diagnosis part also allows you to get more visibility into why it is not showing, right?
Frederick Vallaeys: Exactly, so if it is not showing up it will give you some ideas why that might be.
Eric Enge: Can you talk about top of bid page estimates?
What we do now is we also tell you how much you have to bid to show in the paid results above the organic results.
Frederick Vallaeys: In the past, we had first page bid estimates, which tell you how much you need to bid, on average, to be on the first page of search results. That’s the page where most people are going to click on ads, because most people do not go to the second page of results. What we do now is we also tell you how much you have to bid to show in the paid results above the organic results. We also offer segmentation in the reports between top ads and the side of the page ads.
Frederick Vallaeys: I did this in one of my test accounts yesterday and it was amazing. On the right hand side I was seeing a much lower click through rate than on the top of the page. That could be different for other people; but it tells you that this is a lot of potential clicks that I gave up by being on the right hand side as opposed to having bid a little bit more and showing up on the top of the page.
Eric Enge: What about impression share data?
You may find that you can get 30% more traffic just by tuning your bids because you only have 70% impression share.
Frederick Vallaeys: Impression share tells you what percentage of the available impressions your ads are being shown for. It tells you how many clicks you are missing out on by having bids too low, or by not having the right keywords. You may find that you can get 30% more traffic just by tuning your bids because you only have 70% impression share.
Eric Enge: I think few people realize that getting a hundred percent impression share is actually very hard, even for your brand terms. There are cases where people are leaving significant amount of the traffic on the table and that they are busily trying to add new keywords to diminishing returns when there is actually can be 20% and 30% gains by just going through and finding places where they are getting low impression share.
 |
Frederick Vallaeys: That’s a great point. Where you should start is with your exact match impression share, because that is when somebody types in your exact keyword. You probably want to show up on a hundred percent of those. Sometimes your impression share could be lower because you are just not able to afford as high a bid. But even if you are in that situation, maybe it is a great time to go and work on your landing page. Somebody is apparently able to bid higher than you are in those instances and that is probably because they do a better job at converting the customer once they come to that site.
That’s where you can then connect on to Google Analytics and take a look at its flow visualization tools and see if there is some road block somewhere on your site that is causing a huge drop off in terms of conversions. If you can fix these types of things, you may be able to afford to spend more for that click and your 70% impression share goes up to a 100%.
Eric Enge: This is particularly powerful when you start with your high ROI keywords, as it can be easy money. Can you also tell us about the social platform integration in Google Analytics?
Frederick Vallaeys: What people on the web are starting to realize is that a lot of activity around your website, around your content is actually not happening on your own website anymore, and it is happening through social platforms. We are working right now to include some of that data such as likes, and +1s, and thumbs up, and votes and all that stuff that you get on third-party sites and bring it into Google Analytics so then you will have an even better view into how people engage with your brand and your site on the internet today.
Eric Enge: This is an expansion beyond what you talked about before with the social reporting
Frederick Vallaeys: Exactly, it is taking it beyond just the Google properties in these cases, so when it comes to +1s, we have all of that data, we can share it with our advertisers. There are a number of social properties that would be interesting to get some data about how people are interacting with your site and brand. We are building an API so that those other companies can plug into the Google tools and then hopefully they will be able to show the benefit of their platforms to advertisers, because those businesses will start seeing these metrics inside Google Analytics.
Eric Enge: Of the things we have discussed, what are the priorities, where do I start, what do I do first?
Frederick Vallaeys: I would definitely go to all of the segmentations that we have talked about, that is the number 1 thing, just look at those segmentations for your account and start looking for big differences. So, if you see there is a big discrepancy between your mobile performance and your desktop performance or your tablet performance, then that’s a good indicator that you need to focus on that.
Eric Enge: Great! Ryan, any extra thoughts from your side?
Ryan:Ryan Voccola: One minor thing I did want to touch on, we talked briefly about Ad Diagnosis, there is a bulk ad diagnosis feature in the account and that’s under the 'More Actions' button which will allow you to bulk diagnose a set of keywords and gain insights without having to go to the ad preview tool.
Eric Enge: Excellent. Thanks Fred and Ryan!
Frederick Vallaeys: Thank you!
Ryan:Ryan Voccola: Yes, thanks Eric!
About Frederick
Frederick Vallaeys is a Product Evangelist for Google AdWords. In this role, he helps advertisers learn about which Google products can best solve their marketing needs. He also represents the needs of advertisers with the engineering and product management teams. His main product focus is on ads quality and bulk tools like the AdWords Editor and the AdWords API.
Prior to Google, Frederick was an engineer at Sapient and a part-time wedding photographer who found new customers through AdWords. He joined Google in 2002 to help bring AdWords to the Dutch and Belgian markets. He earned his B.S. degree in electrical engineering from Stanford University in 2000.