One of the web analytics packages that we have been evaluating during our Analytics Study is Clicktracks. Clicktracks offers a powerful analytics capability, at an affordable price. So as part of our 10 Cool Things analytics article series, I thought it would make sense to dig into it a bit deeper. I sat down with Joy Brazelle, Director of Professional Services for Clicktracks, and we went through 10 cool things you can do with Clicktracks. Here they are:
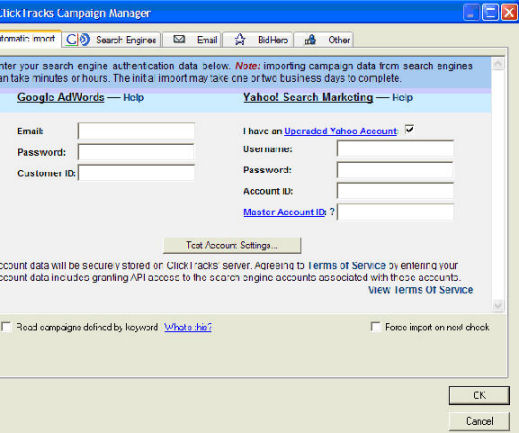
1. Optimize your PPC Campaigns: One of the nice things about Clicktracks is that it offers some basic bid management capability without having to purchase an additional software component, as is required by some of the other vendors. Setting up your campaigns in Clicktracks is easy. Just start by entering in your Google and Adwords PPC Account information into this screen.:
 |
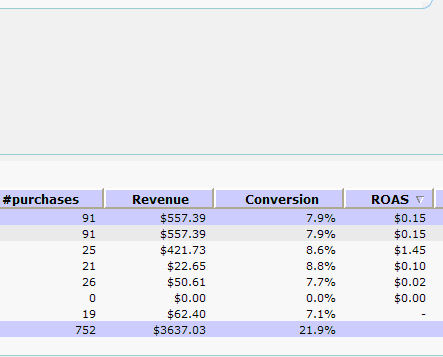
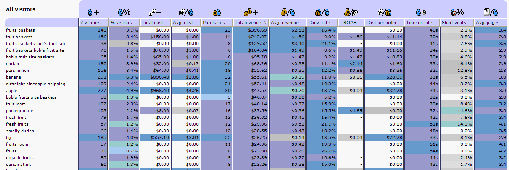
Once you have done this, Clicktracks will pull down the data from your campaigns every night. Next, Clicktracks provides you with an excellent one screen view that shows the Return On Ad Spend (ROAS) for your campaigns. You can sort on this column by clicking on the column title. Now, at a single glance, you can see which campaigns are underperforming. Any campaign that shows a total of less than $1.00 in this column is losing money.
 |
You can use this to flag campaign losing money, so you can then focus on fixing them, or if that is not possible, stop the bleeding. In addition, you can look at the campaigns that are doing well, and see what you can do to dial up the volume, either by adding more keywords, or upping your bids on this campaigns.
Key tip: Before making any final conclusions on how a campaign is doing, be sure you are looking at a date range which is producing a material number of clicks and conversions for your campaign, to make sure the data you are looking at is meaningful. For a business that sells component parts, for example, this might involve a hundred or so transactions. Of course, you can also use this screen to get a quick snapshot of how you did on a daily or weekly basis too.
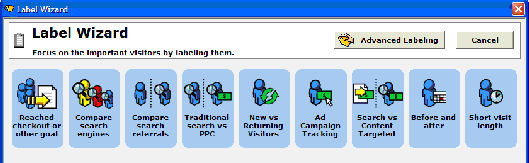
2. Slice and Dice your Visitors with Segmentation: One of the most important concepts in web analytics is segmentation. Segmentation is the process of looking at specific groups of visitors, and analyzing their behavior separately. For example, you can look at your PPC traffic and your organic traffic separately. You can look at your European and US users separately. You can look at people who come into your site on a specific landing page separately, and so forth. Setting this up in Clicktracks is a snap, using the powerful “Label” functionality built into the product. Here is a look at the Clicktracks Label Wizard:
 |
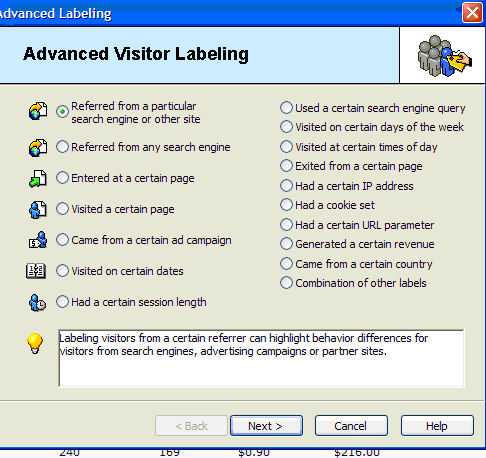
Here we get a look at all the segmentation options that Clicktracks makes available:
 |
Making this more powerful is the fact that if you select URL based criteria (such as “Entered at a Certain Page”), Clicktracks allows you to use Perl compatible regular expressions to define groups of URLs. This allows you to create segments out of URL groupings that would not otherwise be readily possible. In addition, Clicktracks allows you to combine labels to create yet new labels:
 |
Now you have a very powerful segmentation capability. Once this is all set up, the labels will now appear in all reports:
 |
Segmenting your traffic allows you to see what various groups of users are doing, and how their behavior differs. With this information, you can optimize the pages of your site to tailor to the needs and expectations of those different groups of visitors.
3. Apply New Analysis to Old Data: Clicktracks allows you to perform ad hoc analysis on old data. What often happens when you are looking at your data or some report, is you find yourself thinking “I would like to know how this group of visitors performed”, and it’s not something you have previously set up. With Clicktracks, you can set up a new label, a new campaign, a new revenue report, or a new funnel report, and re-analyze the historical data on the spot.
 |
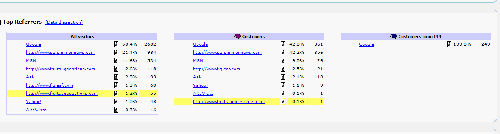
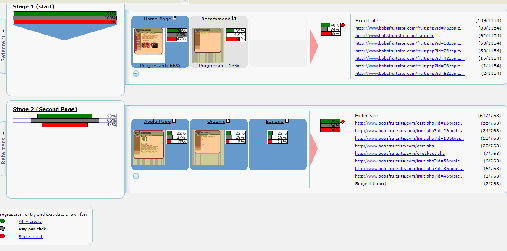
4. Improve Your User Experience: Gaining insight into your visitors is one of the key benefits of web analytics. One great way to do this is through Entrance Path and Exit Path analysis. This type of analysis allows you to see the flow of traffic through your site. Here are a couple of sample screenshots (note that the Previous Page/Next Page screenshots do show up next to each other on one screen within Clicktracks – we just had to break up the screenshots for purposes of this report, so that the screens would be more legible):
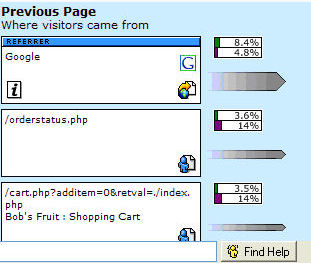 |
Here is the Next Page portion of the screen (normally show up just to the right of the Previous Page information):
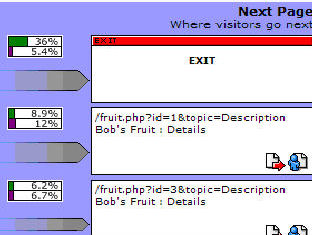 |
You can use the Navigation Report to trace the steps your users go through from start to conversion. For a quick visual of your sales funnel, configure a Funnel Report. Here you can quickly see what steps in the process are the ones where users bail out. Not only can you see what steps people are bailing out on, but you can also see where people are going. If they are going to another information page on your site (e.g. the About Us page), you can consider adding more information on key pages of your funnel to lower the leakage rate.
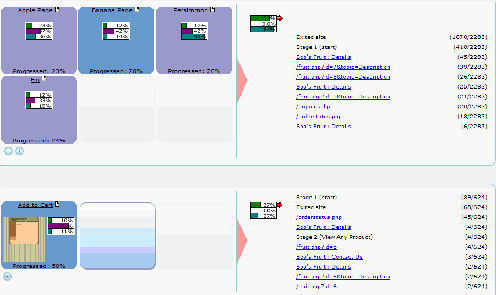 |

Here is a second view of the funnel with the percentages shown by segment:
 |
5. SEO Optimization: Clicktracks offers a cool set of search engine reports that can help you improve your SEO Optimization. For example, the search engine report gives you a rapid view to the keywords that are bringing traffic to your site, broken out by search engine. This provides quick visibility into what terms you are ranking for in which search engine. You can also easily see the average time on site, cost per visitor, revenue per visitor, total revenue & conversion rate for each keyword:
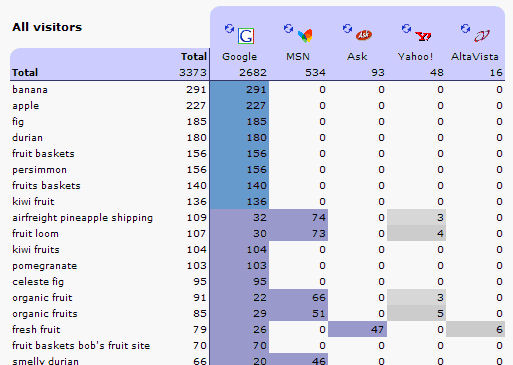 |
Clicktracks also provides a detailed Robot Report. Note that this assumes that you are using Clicktracks in the mode where it reads your raw log files rather than using Javascript. Pure Javascript implementations cannot show you crawling data, because the robots to not execute the Javascript. This capability is a nice feature of Clicktracks, because not all analytics packages offer it. With the Robot Report, you can see the visits by each robot on a page by page basis, including the frequency and the number of visits for each page:
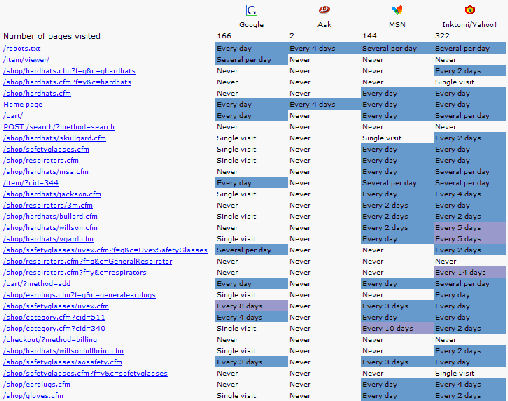 |
Last, but not least, Clicktracks offers a Robot Simulation Mode. You do this in the Navigation Report, but switching it into this mode, and then you can step through your site and find out how the robots see it. This can help you find pages that the robots can’t get to. You would be surprised at how many major sites have problems that relate to pages being inaccessible to the search engine crawlers. The Robot Simulation Mode is a tool to help you discover these problems:
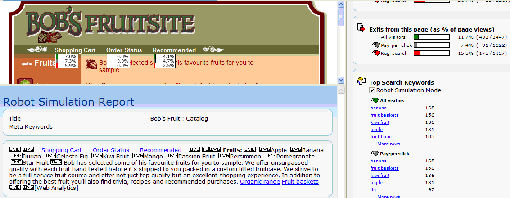 |
Together, these tools provide a rich set of capabilities for SEO optimization. You can see what keywords are driving traffic to your site, which ones are converting, and which ones are not. You can also see what pages are being crawled, which ones are not being crawled, and then use Robot Simulation Mode to figure out why.
6. Contextual Analysis: Clicktrack’s Navigation Report allows you to see information in context, while navigating your site the same way a user would travel through your site. Seeing your actual web page the way a user sees it, along with analytics data embedded on the screen, and other key data on the right allows you to see the analytics data in context.
For example, in the following screenshot, your first observation may be that the bounce rate from the page may be unusually high, and based on that you take a closer look at the page itself. What becomes quickly evident is that none of the key data that users may be looking for, such as pricing, is not visible above the fold:
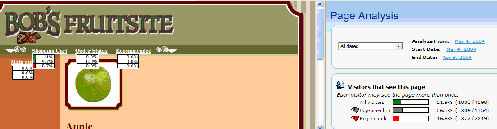 |
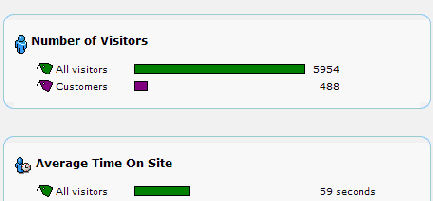
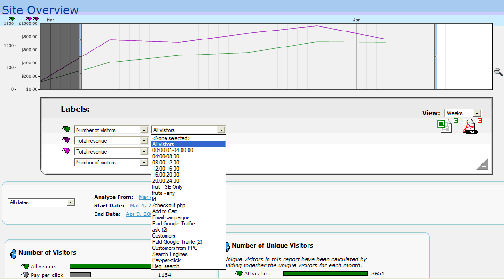
This type of analysis can help you better understand where to place key data and links on each page of your web site. Similarly, the Site Overview Report is cool because you can get all the key metrics for your web traffic in one place. You can also create Labels (segmentation) and turn on Key Performance Indicators (KPIs), and all of that data will also be automatically integrated into this report. Integrating it in this fashion allows you to get a quick and detailed snapshot of overall site performance:
 |
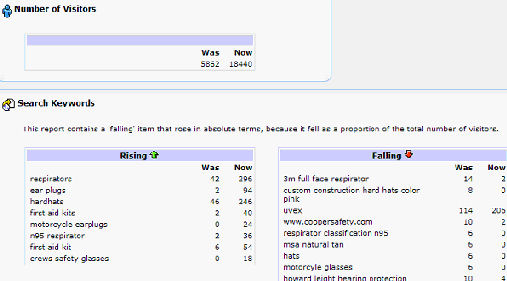
7. Powerful Testing Capabilities: Testing is at the heart of Web Analytics. There is no surer way to get a positive ROI on your analytics investment. Clicktracks provides a What’s Changed Report to give you a quick snapshot, even with just a few days worth of data. The report highlights changes broken down by metrics like the number of visitors, campaign visitors and most popular pages and keywords.
The What’s Changed Report keys in on significant changes, so you see the most important data at a glance. For example, this report will consider a brand new campaign that generates it’s first clicks a significant change, and you can get quick visibility on your results. You can further enhance this report through the use of Labels, which is great if you are targeting your changes at a particular user segment.
 |
For example, you can create two different ad groups with different landing page URLs, and different ad copy, to see how they compare to one another. Then you can swap the landing page URLs to see how the matchup of your ad copy to landing pages affects results. With the What’s Changed Report, you will get a quick view as to how the changes affected results.
8. Keyword Analysis and Research: Clicktracks makes it easy to find your top performing keywords. With the Search Report you can quickly see the best keywords by focusing on the Pay-Per-Click Label, and examining KPIs, such as total revenue by campaign, highest conversion rate by campaign and ROI. You can also easily look for keywords that have a high conversion rate or a high average time on site, both of which are strong indicators of potential.
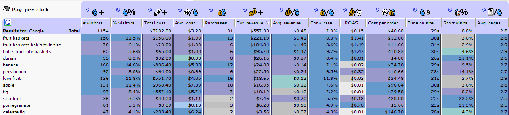 |
Chances are that your best-performing keywords are not broad general terms, but more vertically oriented terms. Finding these quickly can help you speed the optimization of your PPC campaign results. You can go further with this by using the Data Dissection Report. This report allows you to sort on its various columns, such as most page views or most revenue. It’s also easy to spot organic keywords as these will be the ones that zero cost:
 |
9. Click Fraud Detection: Clicktracks is well known for its Fraud Detection capabilities. The Click Fraud Report allows you to get a fast view of potential fraud problems, as well as isolating problems that are simply due to bad ad copy. Some of the potential indicators of click fraud are:
- High percentage of short visits teamed with a high ATOS (Average Time on Site)
- No referrer
- No keywords
- No conversions
- Concentrated clicks
- Unusual change in campaign behavior
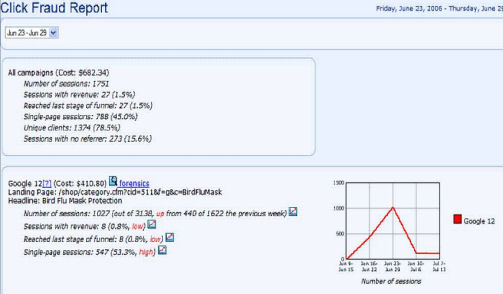 |
In addition, to spotting these potential signs of trouble, Clicktracks makes it easy to sort out many false indicators of click fraud. For example, several of the above listed problems are also signs of a poorly structured ad. Clicktracks makes this easy to detect:
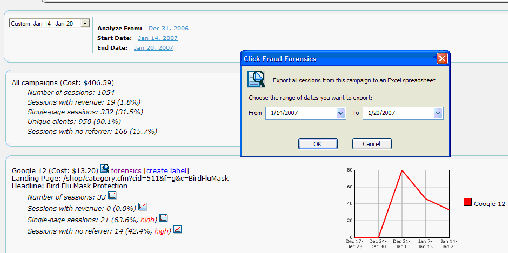 |
The ad shown here has been flagged in the Click Fraud Report, but it may simply be a bad ad, because it has been flagged for low conversion rates and high bounce rates. But if you think you do have a click fraud scenario, click on the Forensics link, and Clicktracks will dump all the information from the suspect campaign into a spreadsheet format for you.
10. Track KPIs Over Time: Key Performance Indicators (KPIs) are also one of the fundamental components of your web analytics investment. A good Key Performance indicator is one that you review on a regular basis that may lead to your taking some action. If changes in the KPI you have selected will not end up causing you to take some action, then it is really not a KPI. Here are some example of good KPIs:
- Number of qualified visitors to the site
- Total PPC ROI
- Conversion rate
- Lead capture page completions
- Total visitors to the site
- Total page views
Good KPIs help you assess the business at a glance, and give you quick signals when significant changes have occurred. Based on these KPIs, you can take quick action to capitalize on an opportunity, or in reacting to a setback. A set of KPIs is also an excellent way to communicate with senior management in your company, by giving them a quick view to the most important metrics of your website performance.
A good way to start defining your KPIs is to first develop a clear understanding of the business goals of your web site. This starts with really basic questions, such as:
- Why do you have a web site?
- What markets are you targeting?
- What are your online business goals?
- How do you measure success?
- What level of ROI are you looking for?
Once you understand your business goals, you can then determine the metrics you want to track over time:
- Number of visitors
- Visitors as percentages
- Bounce Rate
- Total cost
- Cost per visitor
- Number of purchases
- Number of forms filled out
- Number of contact us requests received
- Total revenue
- Revenue per visitor
- Conversion rate
- Return on Advertising Spend (ROAS)
- Cost per order
- Average time on site
- Short visits
- Page views per visitors
- Total page views
Lastly, you can segment this data to get an even deeper look. Here are some example segments to look at:
- All Visitors
- Pay Per Click
- Natural Search
- Customers
- Geographic Location of the Visitors
- By Landing Page
- Whatever specific segment is important to you
Setting this up in Clicktracks is easy. Once you are set up, you can select the values you are looking for from drop-down menus, and pick an appropriate date range. Here is an example of this in the Site Overview Report.:
 |
Summary
Clicktracks is a powerful analytics package at an affordable price. The user interface provides for easily understood and processed analytics data. You can do a lot of detailed analysis with Clicktracks that cuts to the core of what you are trying to accomplish with your web site.