
Dennis Mortensen
Dennis R. Mortensen is a pioneer and expert in the Analytics industry. He is an accredited Associate Web Analytics Instructor at the University of British Columbia, the Author of data-driven insights with Yahoo! Web Analytics, and a frequent speaker on the subject of analytics and online marketing. Mortensen is an Entrepreneur and was the COO of IndexTools until it was acquired by Yahoo! Inc., in May 2008. Today he is the Director of Data Insights at Yahoo! and sits on the Board of Directors at the Web Analytics Association, and he maintains the highly popular analytics blog, VisualRevenue.com/blog.
Interview Transcript
Eric Enge: Can you start with an overview of what has happened to IndexTools/Yahoo! Web Analytics is since the acquisition of IndexTools last year?
Dennis Mortensen: We were acquired on May 9th, 2008, and we are now one year into the integration project. We did a first simple update five months after the acquisition, which was renaming and re-branding the tool to Yahoo! Web Analytics plus a number of minor adjustments. This including a couple of new features that was supposed to come out in the upcoming IndexTools version that was on the verge of being launched anyway.
We then spent the last 7 months retooling this from the bottom up, meaning that we are now extremely close to being able to disconnect and shut down the IndexTools data centers and move all legacy clients over to Yahoo. We are moving forward on having a completely different level of scalability, both from a vertical and horizontal point of view.
From a vertical point of view, we are now able to take on very large clients. From a horizontal point of view, we can now take on a lot of clients. Not just having 5,000 clients, but knowing how to handle 50,000 or 200,000 clients is what aspire to. At the same time, with Yahoo! Web Analytics version 9.5, which just came out on April 28, we managed to include a number of very interesting points on the front-end, including demographic dimensions.
This is not just demographic reports, but actually true dimensions within the analytics engine. This is also true for the new psychographic dimensions we included. We also introduced new visualization capabilities from a tool that we previously called Rubix, which IndexTools had been developing on. We’ve moved that into Yahoo! Web Analytics now. We also came out with new negative segmentation opportunities. For example, you can now look at people who did not buy or people who bought but paid less than $100. This is the reverse attitude of the segmentation process that you usually do. Finally, we are rolling out the new version of the tracking code, which is version 5.
This version is now served off the Yahoo infrastructure, and of course, it has a completely different level of stability. All in all, I think we have around 30 smaller updates. We also increased the number of actions (or goals as it is called in GA), to 50. We also included 38 custom fields for everybody, not just the selected enterprise segment, so now this is not a professional services request; it is something that’s included in the tool. We also actually managed to re-brand it into purple.
Eric Enge: What’s the use of the tool if it’s not in purple?
Dennis Mortensen: You and I know that it does not mean anything, but funnily enough this is something that people notice, and it’s a very good indication of us truly moving from IndexTools to Yahoo! Web Analytics. Most people seem to believe (and fairly so) that it is accurately handed over to Yahoo now.
Eric Enge: I am sure that’s a goal you personally have been pursuing with some passion.
Dennis Mortensen: Very much so. I think the finest task of entrepreneurs who have been working on a startup is to make sure that they actually end up handing over the keys to the acquirer so they can run the machine. I have personally been working very hard in getting us to the point where we could say we did the job and we did it very well.
Eric Enge: What are your thoughts on the impact this product will have on your competition in the analytics space?
Dennis Mortensen: Before I answer that directly, let me try to answer it a tad indirectly first. I believe it’s almost naive to think that any media company can be in business without providing some sort of data back to its customers. You get reporting back if you buy a newspaper, TV or radio ad, so companies like Yahoo, Google and Microsoft need to do that as media companies as well. What happens at the same time, of course, is that you have a set of companies providing independent data collection and independent reporting; such as Coremetrics and Omniture.
We need to look at it from those two viewpoints. So, coming back to your question; in regards to the media companies, I don’t really think that it means too much. I don’t believe that people will choose Yahoo! Media over Google Media based upon the type of analytics that we provide. They will just expect us to provide an average or an above average level of reporting and/or analytics.
It’s important that people understand that even though we collect and report honestly, you can present data in any number of ways, still being honest, but still favoring towards your own business. Look at a simple question such as attribution. If I spend $100,000 on search advertising and use Google Analytics, search will probably look more successful than it really is by the pure fact that they tend to report on last click attribution, and this is especially true if I’ve compared that to display campaigns.
If you look at Yahoo! Web Analytics, we provide multiple attribution models, including the original referrer. The original model is typically the one that comes in from display, which is media that Yahoo is very good at. I am painting a different picture of the same dataset, and I think you’ll see the different media companies do that to some extent. So to conclude, that’s one part, where you’ll see us compete, namely on the type of insights that we provide to our customers.
On the other side, I think you will see independent vendors really have to expand on their products because Yahoo! Web Analytics and Google Analytics are getting more feature rich. The technology is simply becoming better and better, but that said, I would like to confirm that we are not out to compete against or replace The Coremetrics or the Omnitures. We are simply there to provide the best possible insight to our customers. That might happen to be somebody who is using Omniture and might choose to use our product instead, but that’s not really the goal. We just want him to be enlightened.
What happens then, and the reason that they have to expand on their product portfolios is that all of a sudden we will do things with our analytics products that they simply can’t do with, such as Yahoo! demographic information. It is something that only we can do, and Omniture or Coremetrics can’t do this, because they don’t have access to the rich dataset of user behavior on Yahoo! web properties. They need to figure out other ways of being competitive, and I think that’s their task.
Eric Enge: Let’s dive into the demographics features in a little more detail.
Dennis Mortensen: Let’s just provide a quick example so we know what we are talking about here. Let’s say that I am a customer of Web Analytics provider X. The way that works is that I will call up my vendor and he will provide me with a JavaScript data collection tag. I’ll put that on my website, and by doing that I will start collecting data. Then it essentially takes data that I have and sends it to my vendor, who, to put it simply, will then reformat it and send it back to me.
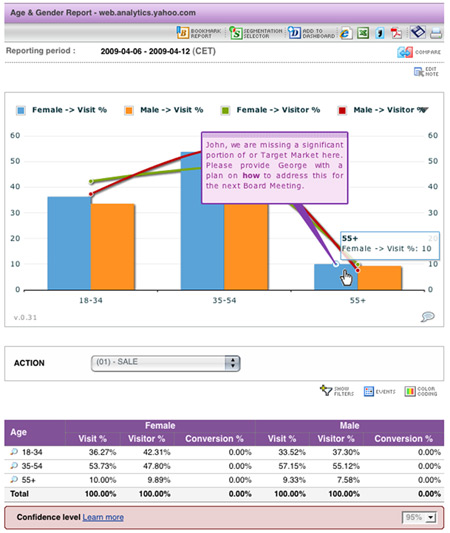
If I send him 10 data points, he will then send me 10 data points back. What media companies can do is collect the 10 data points, but then add 5 more data points and send 15 data points back. Thus, you also get insight on some information that you didn’t have access to before. We’ve tested this out in the release that came out April 28 with a number of dimensions such as age, gender, and interest groups. This way we get an opportunity for everybody who bought this specific product to tell us what they thought the best-converting segment was, and you would be able to know that it is females age 25 to 34, interested in politics and so forth. (Editor’s note: here is a sample screenshot:)
 |
Eric Enge: How many different kinds of data points are you supplying that type of data on?
Dennis Mortensen: We came out with 4 new dimensions, the first of these are gender. Age is second, and as an FYI we provide 5 age groups. The reason for doing this is that we are not just doing this on Yahoo! specific traffic. You can buy an advertising campaign off the New York Times, and we can actually measure against the dimensions of the 10,000 visits that you’ll get from that. That’s why we have fewer groups, so we are actually able to come back with some decent information. Then we have 16 interest groups, including politics, sports, and entertainment, among others. Just as a positive note; we are actually trying to expand that all the way up to 377 interest groups, but it’s something we are still working on.
Finally, but perhaps not as interestingly, is that we still provide information on what type of Yahoo! properties people visit. You might look at a section on your site and you’ll see that you have a large percentage that uses Yahoo! Finance, Yahoo! Sports, Hot Jobs or something like that. That’s probably less sexy, but still an interesting marketing data point.
Eric Enge: How many of those do you have?
Dennis Mortensen: In the hundreds.
Eric Enge: What’s the basis of how you are assembling the data? Are you doing that by seeing who has visited a website, and then matching them up with data you have because they have visited other Yahoo properties? What are the mechanics of all that?
Dennis Mortensen: Without getting too nerdy, it is based upon the fact that we have a huge sample of visitors that we have insight into and who come to one or more of our properties every month. I think the last public number was 550,000,000 unique visitors every month. That is a huge sample. If you just think about this, the guys over at Compete are using a sample of perhaps 2,000,000, and they provide some pretty good information actually.
Some of the visitors we will have more information on than others (all anonymously of course), and some of them we won’t have any information. That means that I won’t have information on all visits, but I will have it on some of them, and some of them are enough for me to provide statistical significant reporting back to you. Just to elaborate a bit on that, we actually provide a very honest way reporting on this, something that we call confidence level, which you can set yourself.
First of all, we are very eager to make sure that we keep our high level of privacy, so you can’t report on anything with less than five visitors. With our tool, you can actually filter down to a single visitor, but if that happens, I won’t report on these new dimensions such as age, gender, and interest because of privacy. Anything less than five, we don’t report on.
You might look at 40 visits from within the last hour and I might not have information enough to provide you with the default confidence level. You can then choose to decrease that confidence level within the tool, and that will essentially provide new reporting back to you on the fly. The reason for that is that sometimes you would want to have a very high confidence level. That could be when you choose how to spend the amounts in a budget; because you want to be sure that you are spending it wisely. Other times it might just be a simple non-significant redesign where you need to get an indicator of whether you want to go left or right, and you might be happy with the confidence level at 70%. So this is something you can set up in the tool, and you can use it for different purposes.
Eric Enge: How is this integrated into the tool itself?
Dennis Mortensen: The really cool thing about this is that there is nothing to install once you’ve been upgraded to the new tracking code. That means that all the clients that we signed up since the acquisition didn’t have to do anything, because they were in a new tracking code to begin with. The legacy clients, as I said earlier, have to be moved over now, so within the next couple of weeks they will have the opportunity to move over to the new tracking code as well.
If you use that, these data points are attached, not collected, because this is information we have already. They are appended to your dataset without you having to do anything. We will give you a couple of reports right out of the box, including an age report where you simply get the distribution and a split on a gender report. You can also see this on the two dimensions at the same time in a matrix. We also give you an interest report because that’s a good way of getting started so you can see what your segments are.
That said, the most powerful fact, in my opinion, however, is the opportunity to use these in filters. You might look at sales from yesterday for a specific product, a specific campaign or a specific section of your site. You can choose to filter by these dimensions. If you want to look at the sales for these specific products, you can filter it by gender and then you will get specific information for those products, which might be very different than for other products. So it’s not just about giving an overall average for the whole site, it’s an opportunity to use this wherever you see fit throughout the tool.
People might compare this to what they saw in the now discontinued Microsoft adCenter Analytics, but they provided a couple of reports out of the box. We were very eager to make sure that this was not just about a set of fixed reports, but actually a true opportunity to use those dimensions within the reporting system.
Eric Enge: As you’ve always said, even from the early IndexTools days, you were never interested in helping people do report surfing. The goal was to give them a tool where they could build their own queries and do their own thinking. You’ve been consistent with that here it sounds like because the ability to track these metrics in the filters is very interesting. You can see how many sales you’ve made to people of a certain age over a specific period of time, and you can see if your sales become very centric on a certain age group over that time period, for example.
Dennis Mortensen: Exactly. Let’s use something simple here. Let’s say you have a 2-year old website, with 20,000 visits whose visitors are split 50%-50% between men and women. Then you look at your sales, however, and you might figure out that it is fine that you have an even gender split for traffic, but 90% of your sales are coming from females, and that is an insight you can actively use for changes. Not just that you have an even split, but that the sales are coming from one specific demographic. Then you can start to figure out how to deal with that problem specifically. You might even increase spending on some campaigns, and decrease it on some on the others.
Eric Enge: Or you can just change the focus of the landing pages.
Dennis Mortensen: Indeed!
Eric Enge: There are a number of things that you can do with that kind of data, and there are a couple of other things that you mentioned that piqued my interest as well. You talked about negative segmentation. Can you expand on that a little bit?
Dennis Mortensen: Usually when people think of segmentation, it’s about including things such as people from New York or people who looked at a specific page on the site. That’s how we tend to think of doing segmentation. What we’ve included now is what I call negative segmentation. Making sure that you do everything but this defined thing; I might for example like to see people who did not read about shipping details. I might want to see people who didn’t come from New York, where we have an offline store. Negative segmentation is a powerful new way of trying to get insight on your visitors.
Eric Enge: I can imagine there are an awful lot of things you can do with that. You can certainly combine negative segmentation with positive segmentation, for example.
Dennis Mortensen: Exactly. You can choose to look at people who bought something but didn’t look at the shipping details.
Eric Enge: If you see that 70% of your abandon rate happens after people look at your shipping charges, you can decrease the price of shipping, but you can only do that by doing some of these comparisons.
Dennis Mortensen: Agree.
Eric Enge: Can you talk a little bit about the new path analysis details as well?
Dennis Mortensen: As you know, there is a huge debate in our little analytics community on the value of path analysis in general. Some people say that it’s completely bogus, some people say it provides decent insight, and then we see some people simply use it to figure out how people navigate, where people drop off and essentially to get insight into how people go around their site. I am not advocating path analysis, but I’ll tell you what the new edition includes.
What we had before was an opportunity to see two levels deep, and only ten steps on each level. What I am talking about here when we say path analysis is for example, that when you can look at the last five steps in an eCommerce funnel, and before people move from checkout to payment, you have a drop off of 60%.
Since 60% obviously didn’t go down the funnel, they clearly went somewhere else. You want to investigate where they went, and for that, you can drill into the path. First of all, the new path analysis is a Flash Application. So you are thrown into a Flash app within our UI, which you can actually expand into full screen and really work the path analysis. You can now choose not just to see one or two steps, you can drill into endless steps.
Let me expand on this a little bit. Say I want to look at the 30 pages that my visitors go to on my website, I can actually now work the path analysis much more visually because you can move items around. If you imagine an elastic spider web, that’s kind of how it looks and that’s how you can navigate around it.
Eric Enge: There is a lot of flexibility in how you route it.
Dennis Mortensen: Yes. You are not limited to two levels anymore. This is very flexible and unlimited levels now, plus you can expand it and work at full screen, so all your work canvas is the path analysis.
Eric Enge: Can you speak a bit about the changes in visualization techniques?
Dennis Mortensen: Most people will agree with me that most analytics applications are set up in essentially the same way. In the upper left corner, you have a calendar, below that you have a menu with a number of reports that you could choose. On the right-hand side, you have a chart, below that you have a set of row-based data. That’s how you build up an analytics application, and that’s all good and fine, but what we are trying to do with this new version is to improve the chart itself.
Let’s say you look at visits for the month of May, you’ll have that as a bar chart, and you’ll have visits on the y-axis and the dates on the x-axis. You’ll also have a number of bars illustrating how many visits you have for every day. That’s fine, and it used to be static and illustrated very nicely, but we’ve turned that into an active component now. That means you can expand on it and chose how you want to visualize it.
You can turn it into a trend chart, a bubble chart or into a bar chart and work it that way. That is not the powerful thing here though, the powerful thing is that you can choose to work with multiple metrics at the same time in the chart. I might customize the reports, so I can have visits, time spent on the site, bounce rate, average value per order, and a number of other metrics as well. What I can now do is choose how I want those to be visualized in the chart. I might want to visualize two or three of them at the same time, trying to spot a potential correlation.
I might want to use bar charts, but I want to color them based on the bounce rate. So if there is anything out of the ordinary, I will be able to tell from the chart itself. We even expanded it to the point where people are actually able to apply notes to elements on the chart. You can start writing notes on the chart, that’s how flexible we’ve made it, and when you are done it works just like it did before.
I think we all agree that we can have data that might provide insight, but I can’t visually see it because I have too many numbers to process in my head. I can keep drilling down until I get it, but if you have the right visualization opportunities, sometimes you can very quickly gauge where you have issues and then you can start working on them. Visualization is not all about coolness, I think it’s actually a pretty essential element to have. Most people have charting of course, but I think we tried to take it just one step further. Not magic yet, but just one step further.
Eric Enge: Is the tool going to be available on an open basis to non-Yahoo advertisers?
Dennis Mortensen: I believe there is an understanding in the market that we are supposed to become a free for all tool like Google Analytics and thus creating a head-on competition. There is nothing more fun than a competition, but that doesn’t mean that it’s the right thing to do however. At the current time, we have no intentions of turning this into a free for all solution. Don’t expect us to put up a webpage where you signup, you get a JavaScript and then you can go track your website. That’s not really what we are shooting for.
We are looking for opportunities to connect with advertisers and publishers in the sophisticated end of the market. That means we’ll probably not ever get to the million accounts or however many accounts Google Analytics has, but that’s not really our target anyway. If we can just capture the head- and torso end of the market, we’ve pretty much solved what we set out to solve. That said, it doesn’t mean that you necessarily have to be a Yahoo! customer in the long run. Right now you need to be affiliated with Yahoo! in some way, shape or form in order to get access to an account, but this is something that we are expanding upon all the time.
Eric Enge: What will be coming down the pike next?
Dennis Mortensen: That is a very good question, but it’s something I would have had an easier time responding to when we weren’t Yahoo!. Now, we have legions of communication and legal folks that make it more difficult, but I think one thing that I can safely say is that you will see us keep appending the data with more and more information simply because of the power of combining a data company with a media company.
I think that’s a safe bet. Another safe bet is the idea of combining post-click and pre-click data information, so you can see what people were doing before they arrived at your website. Just to give you an example if it doesn’t make sense. Some people are actually searching for you or for your products and you will be in the SERP results, perhaps not on page-1, but you will be in the results. I’ll be able to tell you information on their intent before they even visited your site, such as search phrases that they did not click on.
Eric Enge: Right. Like a search funnel.
Dennis Mortensen: That could be one thing, yes. Sometimes people search with seven different phrases. They end up with the last one, and that’s the one they click on, but you have no insight into what happened before that. I think what is happening before that story is something we might want to move into.
Eric Enge: Thanks Dennis!
Dennis Mortensen: You are most welcome Eric!