Wow. So. It’s been almost two months since I wrote my article on setting up Android Debug Bridge. I promised a follow up post on using ADB and the Chrome Developer Tools to debug HTML, CSS and Javascript on your Android device, AND I AM A MAN OF MY WORD. I might not be very punctual, but here we are.
Code debugging is something developers have been doing since developers have existed, and tools like Firebug in Firefox and Chrome’s Developer Tools (CDT) help front-end developers traverse through their HTML, CSS and Javascript code, and make debugging remarkably simple. In the world of desktop debugging, Firebug and CDT are lifesavers, but what about the mobile realm? With mobile sites being a requirement nowadays, how do we debug our code on devices? Enter Remote Debugging with ADB and the Chrome Developer Tools.
If you haven’t already read my aforementioned blog post, take the time now to go do just that. That tutorial is a pre-requisite to this one. And while we’re on the topic, here’s a list of things you’ll need for this tutorial:
- An Android device
- A computer with ADB installed
- A USB cable to connect to your device
- Chrome for Android (Note: This does not work with the stock Android browser. This is a Chrome specific feature)
- Chrome on your computer

Got all of that? Wonderful. Let’s get started.
- Connect your Android device to your computer via a USB cable. You do not need to enable USB Storage, just plug your device in.
- Enable the system’s USB debugging on your device. These steps will differ depending on your device and the version of Android you’re running, so the best way to do it is to Google how to enable USB debugging on your particular phone (e.g. “enable USB debugging Galaxy SII”). The basic steps are to go to your phone’s settings, find Developer Options, then mark the checkbox labeled “USB Debugging” as enabled. How this step differs from phone to phone is where the Developer Options live in your settings, and the wording they use for USB Debugging. For example, older phones running Gingerbread (Android 2.3) house the Developer Options inside the “Apps” directory in the settings.

- While you still have your device in your hand, let’s go ahead and enable Chrome for Android’s USB debugging setting as well (the two settings are different, don’t go and assume I am an idiot and am having you do the same step twice). Open your Chrome app and bring up its settings. Scroll to the bottom and drill into the developer tools, then check the box for “Enable USB Web debugging.”
 Boom. You can now put down your phone.
 - Go back to your computer so we can check to make sure ADB is working properly. Open a Command Line window on your computer (Terminal if you are on a Mac) and run the following command.
adb devices
If everything goes well, you should see a message similar to the one below.
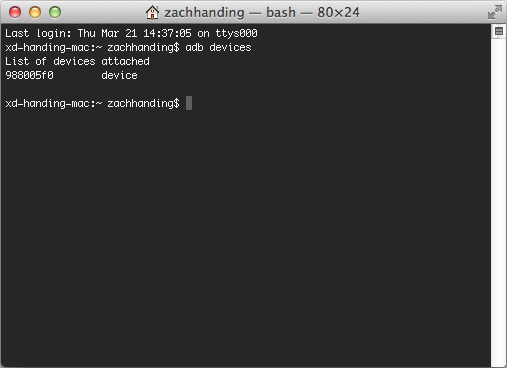
If no devices are found, double check that you’ve properly connected your device, that USB debugging is enabled, and that you indeed have an Android device. - With your device connected and ADB running properly, you can now run the magical command that enables remote debugging. In your command line window, type the following (do not copy and paste) and press Enter:
adb forward tcp:9222 localabstract:chrome_devtools_remote
There will not be a confirmation that it worked, unfortunately, so you’ll just have to trust in your ability to read and type. Side note: someone remind to alter the requirements list to include “Basic Motor Skills.”
Done! Almost. You now have remote debugging set up and enabled, so let’s dive in and get our hands dirty…with science!
Jump back onto your Android device, and open Chrome. Go to whatever website you’d like to debug, or for the sake of this tutorial go to any website at all because it doesn’t matter. Now with at least one open tab on your device, launch Chrome on your desktop as well and type in this URL:
localhost:9222

Your screen should look like the desktop screenshot above, displaying all the open tabs you have on your Android device. Now when you click on one of the sites, you’ll be viewing the site on your device and seeing the Chrome Developer Tools pulled up for that site on your desktop.

This is the epitome of unbelievable right here. JUST LOOK AT THAT. Your computer is displaying live information about a website you are viewing on your mobile device. If your mind is not currently blown there is something wrong with you. This allows you to traverse through the HTML and CSS like shown above, but you have access to the entirety of Chrome’s Developer Tools now, including the Console. As you can see, I have been using remote debugging to test touch events for mobile websites. This was not possible before, considering I do all of my development on a desktop computer that does not support touch events.
I hope this tutorial has given you some insight into how powerful browsers are becoming now, and the level of synchronicity we are achieving between desktop and mobile experiences. I am aware this is a weak conclusion paragraph.