Clients often ask the question: Is it better to use Oracle Hyperion Smart View or Financial Reporting? The short answer is, why not use both?
By understanding both Smart View and Financial Reporting, you can present the same data and the same financial reports. However, each bring a unique set of capabilities to the user.
Let us look at each option and then talk about leveraging from both.
Smart View
Oracle Hyperion Smart View for Office (Smart View) provides a common Microsoft Office interface designed specifically for Oracle’s Enterprise Performance Management (EPM) and Business Intelligence (BI). Using Smart View, you can view, import, manipulate, distribute and share data in Microsoft Excel, Word and PowerPoint interfaces. It is a comprehensive tool for accessing and integrating EPM and BI content into Microsoft Office products.
Smart View has a unique ability for ad-hoc analysis and formula-based data retrieval by providing a link from Excel back to HFM, Planning, and Essbase. Since Excel is the standard for the Finance world, their comfort level with a worksheet is high. In addition, non-EPM based data and calculations can be included. As a result, this reporting option is oriented towards Power and Super Users.
There are always a downside to any product. Smart View has its share. When retrieving data using the ad-hoc method, there is no way to determine if a given value in a cell is the retrieved value or something that someone has entered/changed. When opening the spreadsheet you will need to Refresh the spreadsheet to view the latest and greatest data. When using the formula-based method the spreadsheet will require maintenance when there are Metadata changes.

Guide to Oracle Cloud: 5 Steps to Ensure a Successful Move to the Cloud
Explore key considerations, integrating the cloud with legacy applications and challenges of current cloud implementations.
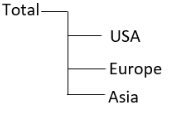
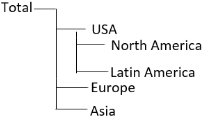
When changes are made to the Metadata, formulas will require manual updates on every worksheet that utilizes the changed dimension. For example, if you have a parent called Total with USA, Europe, and Asia as children and you build the worksheet to show these members, you would have a row (or column) for each member. If you then decide to add children to USA (North America and Latin America), you now need to update the worksheets.
- If the worksheet is using the Ad-Hoc method, you may be able to simply collapse Total and expand to get the new members. Then you will need to verify any formulas and formatting after the collapse/expand is performed.
- If a worksheet is using the formula method, you will need to change USA to include North America and Latin America by inserting a row or column for the new members. Then you will need to update any additional Excel formulas that were added to the spreadsheet.
Hyperion Financial Reporting
Hyperion Financial Reporting enables the development of book-quality financial reporting targeted at meeting the unique requirements of the Finance Divisions or any functional area that requires very highly formatted multi-dimensional reporting.
A graphical, object-based interface enables the rapid creation of reports. It combines grids of data, text, charts, graphs, and images. A library of reusable report components simplifies and streamlines the process of building and maintaining complex reports. Users have complete control over layouts, formatting, fonts, and colors, as well as a flexible range of output options enabling wide distribution via print, HTML Web pages, and PDF.
While Financial Reporting does not have the capabilities of Excel, it does have the advantage of offering drill-down into the hierarchy structure and investigations through related content linking a value to another report view.
With Financial Reporting, you can build a report to take advantage of the hierarchy relationship. In Smart View, we discussed some advantages and disadvantages. Using the example from Smart View, you might create two rows (or columns)—the first row can represent the Descendants of USA, and the second row is the Parent USA. This will allow you to apply formatting for the USA. When the Total hierarchy is changed, you would simply run the report since the first row would always show whatever the descendants are of USA and adjust automatically.
One thing to note about Financial Reporting is that any data displayed on a report or changes to the layout must be complete within the EPM applications. This restriction provides security over your data, which eliminates all users below the Power user level to from making changes.
How to Enjoy the Best of Both Worlds
First, create the Financial Reporting package that is required. The biggest reason is that in maintaining financial reports, changes to dimensions and hierarchies always occur during the span of the company doing business. With the Function feature, if the relationship between the parent and child is changed the report will dynamically update to display the child to parent relationship every time.
Second, Smart View provides the ability to create ad-hoc analysis where you can move dimensions on the fly by working in a free form mode by pivoting dimensions between rows and columns. The capability of drilling into the numbers and running different scenarios is available.
Third, with the use of both Financial Reporting and Smart View, you can design all of the structured financial reports within Financial Reporting and create elaborate Books. Leveraging from the Financial Reports utilizing the Import feature within Smart View will give you a quick start to any formatted report design. You can maintain a high degree of quality, accuracy, and auditable data in your presentations.