I am often asked by clients to create reports that display alternating shaded rows. We’ve all been there, squinting away trying to view those tiny numbers crammed onto a single report. Too often we find ourselves relying upon a ruler to help follow the values across the row as the columns continue to grow across the page. Providing alternating shading in Oracle Hyperion Financial Reporting Studio can help to alleviate the need to locate a ruler. But we can also make the formatting dynamic!
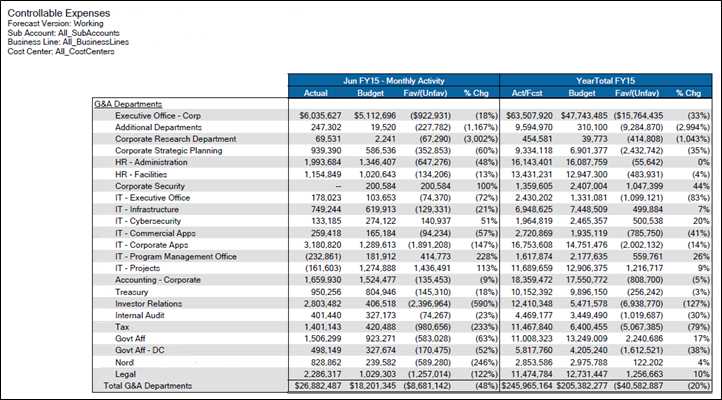
On the report above, the user wanted every other row to be gray (this is referred to as row banding). Instead of listing the Departments on each row and then manually selecting the shading by row; Count, Rank, and Mod formula columns were used as well as conditional formatting. The following graphic is how I created the report above in FR Studio.
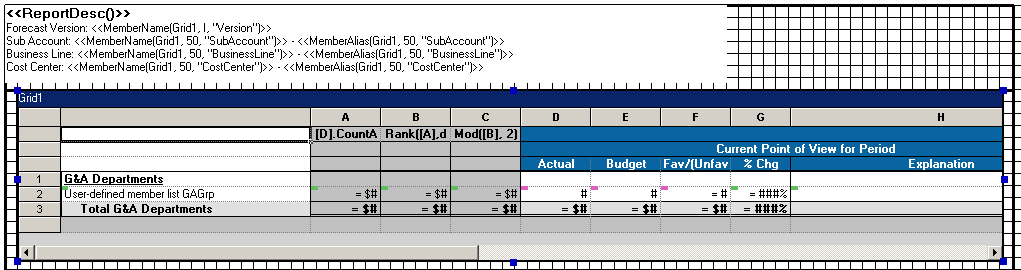

The following table illustrates the formulas used for each column.

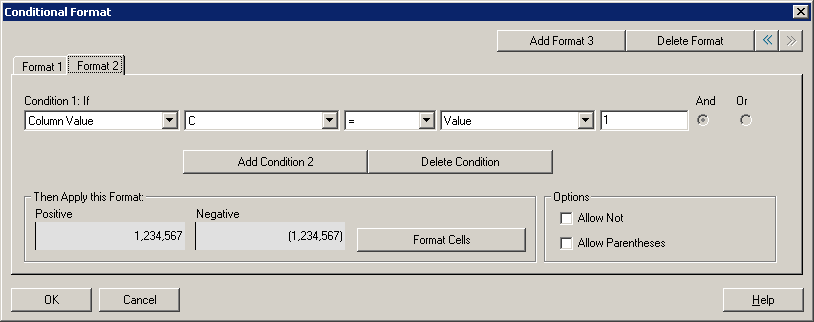
Conditional formatting is then applied to shade the rows gray that meet the following condition:
The results of columns A through C are displayed below:

After you have verified the report renders as expected, ensure to Hide columns A – C on your grid. So there it is; your Ophthalmologist will be pleased!
Great post!
Rebecca, this is timely, thank you for publishing this workaround/solution!
You are quite welcome. Glad it helped!
Very well written post. And still very useful .Thank you RG!!