
1.What is Power BI?
Power BI is a collection of software services, apps, and connectors that work together to turn your unrelated sources of data into coherent, visually immersive, and interactive insights. Whether your data is a simple Excel spreadsheet, or a collection of cloud-based and on-premises hybrid data warehouses, Power BI lets you easily connect to your data sources, visualize (or discover) what’s important, and share that with anyone or everyone you want.

Recently I just completed a Power BI sample report and would like to share the following steps.
2.Create a sample report
2.1 Getting Data and adding relationships
Start in the Power BI Desktop, and select Get Data. The collection of data sources appears, allowing you to choose a data source. The following image shows us selecting an Excel workbook.
Import 5 tables and add relationships between tables (Load whole table without any handle).
Add table relationship between two tables.
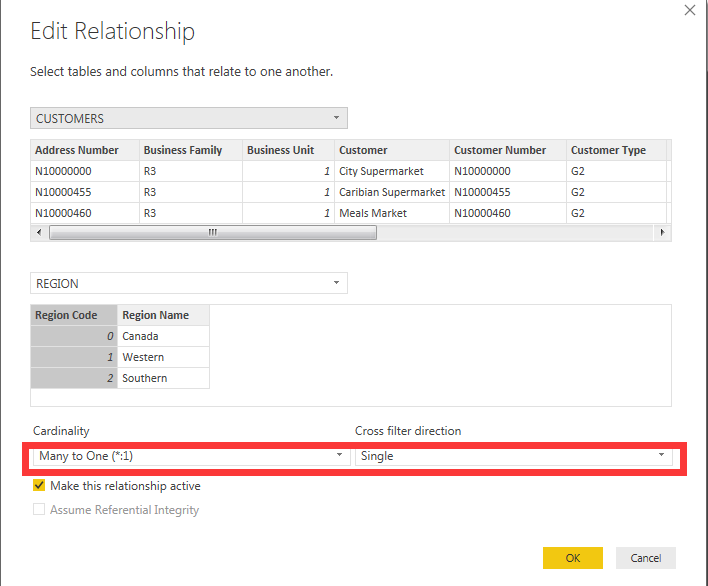
Results:

Tips: Data in the table needs to have a unique value, so that you can add relationships between table columns.
2.2 Create Calculated Columns

The Future of Big Data
With some guidance, you can craft a data platform that is right for your organization’s needs and gets the most return from your data capital.
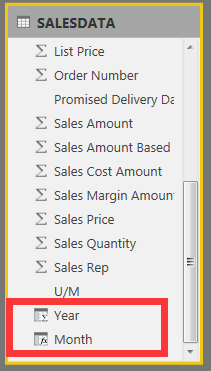
To create a calculated column, select the Data view in Power BI Desktop from the left side of the report canvas. Add Year and Month columns into SALESDATA table.
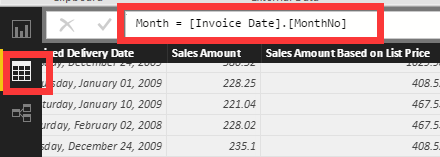
Calculated columns added into SALESDATA table.
2.3 Create and Customize Simple Visualizations
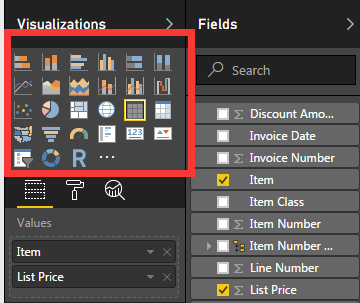
Drag field names from the Fields pane, and drop them on the report canvas. By default, your visualization appears as a table of data.
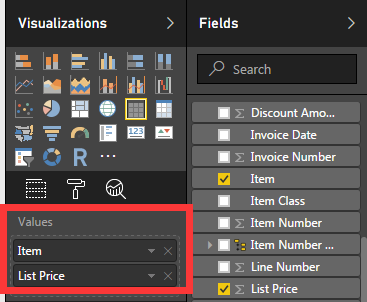
Click the type of visualization you want to create in the Visualizations pane. With this method, the default visual is a blank placeholder that resembles the type of visual you selected.
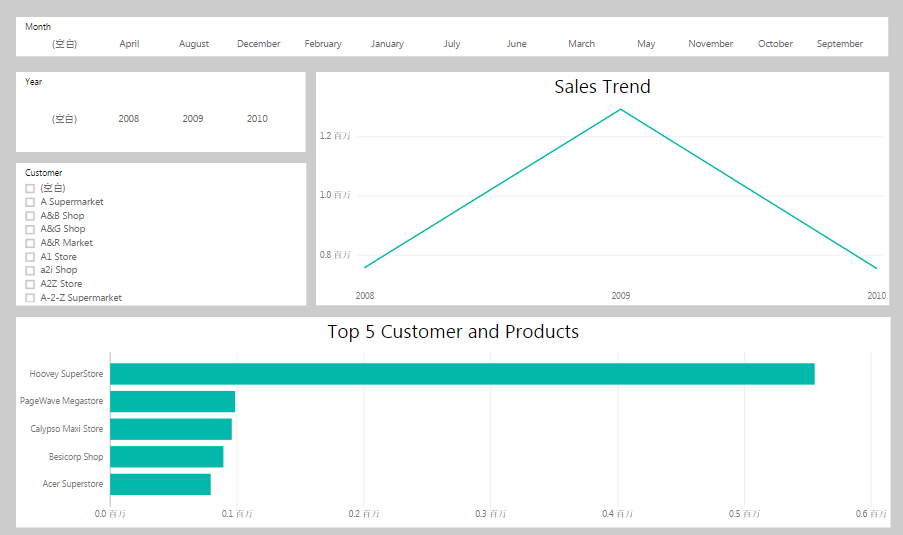
Create a sample report with filter, top five chart show, drill down using upper data model:
3.Publishing and Sharing
Once you’ve completed authoring your report in Power BI Desktop, just select the Publish button on the Home tab in Power BI Desktop, and the process begins.
3.1 Create and Configure a Dashboard
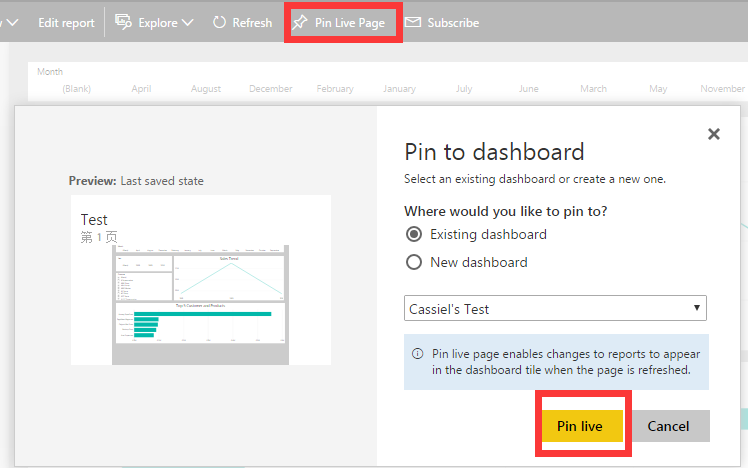
Pinning a visual to a dashboard is a lot like pinning a picture to a corkboard on a wall – it sticks the visual there, in a particular spot, for others to see. To pin a visual, open its report on the Power BI service. Hover over the visual you want to pin and select the pin icon.
3.2 Share and collaborate with colleagues in Power BI
Publish your reports from the Power BI Desktop to the Power BI service
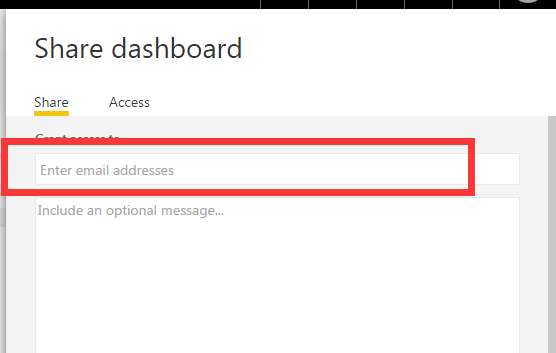
Now your partners can view your dashboard through your shared URL.