
Data & Intelligence

Pie Charts – Your First Visual SSRS Report

In my previous articles, we looked at all the basic concepts of creating a report in SSRS.  We built a simple tabular report and made it presentable.  However, simple tabular or matrix graphs are textual reports.   Today, we will build a visual report – a pie chart.  There are several visual reports one can build using report builder.

1.)    Column graphspie chart

2.)    Line graphs

3.)    Shape graphs

4.)    Bar graphs

5.)    Area graphs

6.)    Range graphs

7.)    Scatter graphs

8.)    Polar graphs

We will focus on building a Pie Chart report today.  Pie chart looks like a Pizza i.e a circle divided into smaller areas.  Every area represents a set of data belonging to a group.  This allows business managers to view the data as a proportion of the whole set of data.  Pie charts also allow business users and managers to compare one set of data with another set of data in one chart.

Let us dive into creating our first visual report – Pie Chart.

Before creating the Pie Chart, let us see how we can divide our data set into different categories.  We have primarily three types of products:

1.)    Candles

2.)    Hand sanitizer

3.)    Shower Gels.

Great – The next step is to create a datasource and a dataset.

We will use the same Data source we created in the previous articles.  However, if you missed previous articles, you can click on the link given below that shows how to add a datasource and a dataset.

https://blogs.perficient.com/dataanalytics/2013/10/25/creating-first-ssrs-report-part-2/

Let us create a new dataset and call it PieReport.  You can follow the steps to create a dataset in the link given above.  The only thing that changes in this dataset is the SQL query. (given below)

SELECT

[candle_soap_shop$].Product_Type, count(*)

FROM

[candle_soap_shop$]

group by

[candle_soap_shop$].Product_Type


Now that we have our datasource and dataset set up, it is time to draw our pie chart.

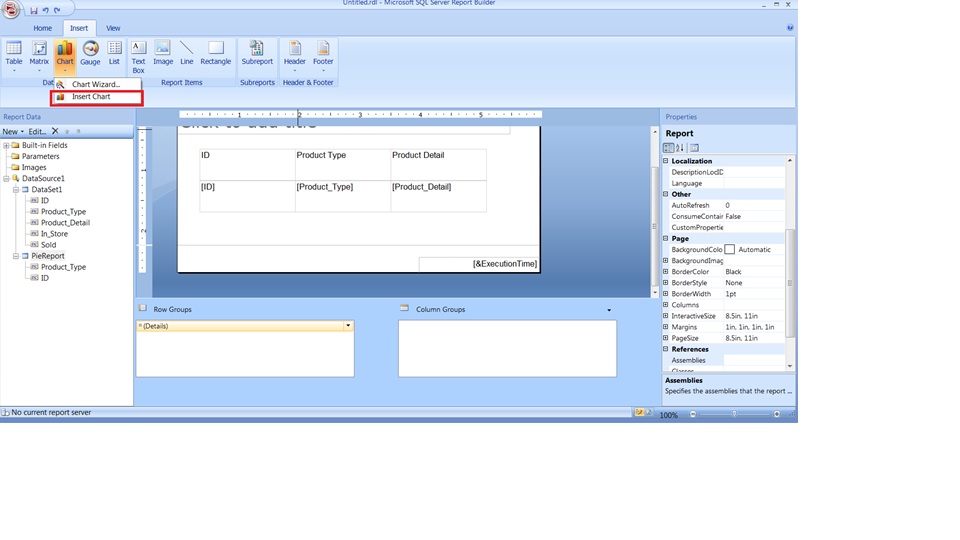
In order to create a Pie Chart:

Data Intelligence - The Future of Big Data
The Future of Big Data

With some guidance, you can craft a data platform that is right for your organization’s needs and gets the most return from your data capital.

Get the Guide

1.)    Click on Chart and select Insert Chart

PieChart2

2.)    Drag your mouse on the white canvas below the table.

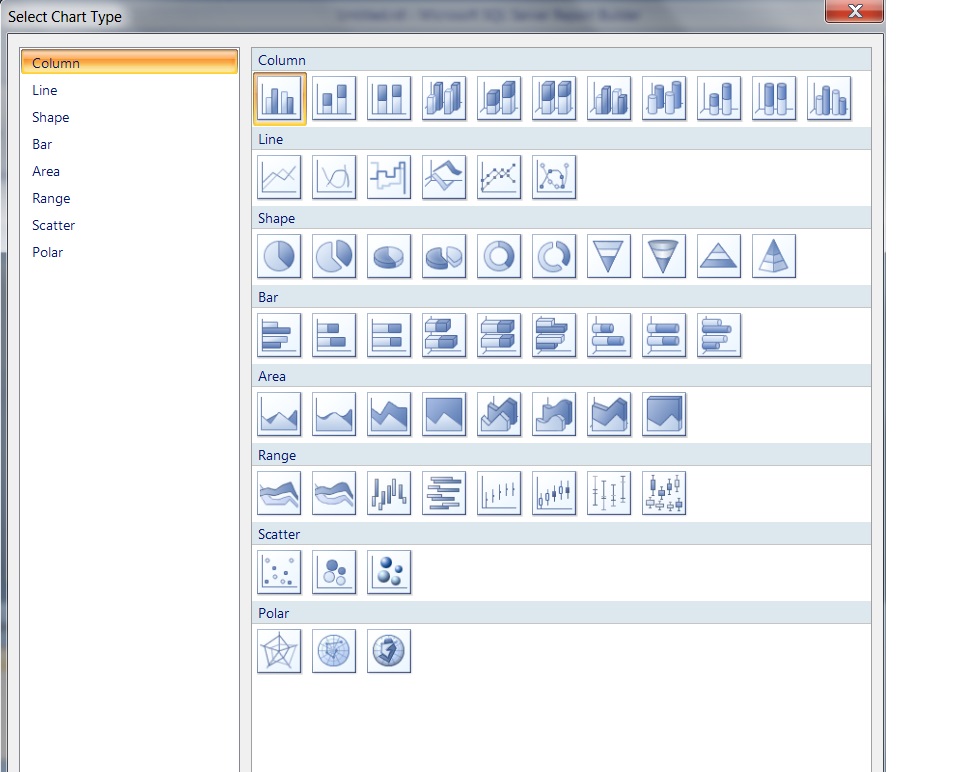
3.)    Select the first Pie chart from the window.

PieChart1


4.)    Drag and drop ID under “Drop Data Fields Here”.

5.)    Drag and drop Product_type under “Drop category fields here”.


PieChart3


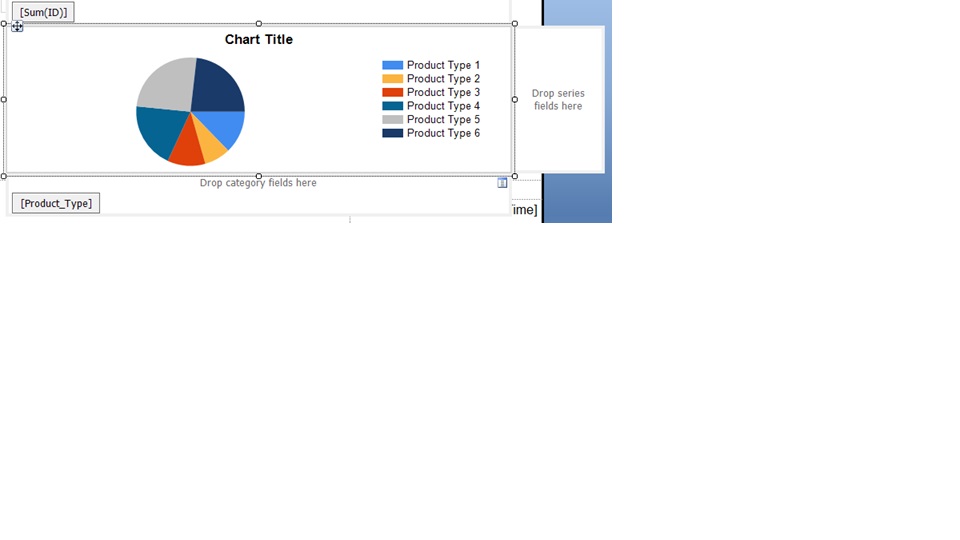
6.)    Right click on the chart and select – Show data labels.


7.)    Run your report.


Stay tuned for more articles.


Jim Miller

Mr. Miller is an IBM certified and accomplished Senior Project Leader and Application/System Architect-Developer with over 30 years of extensive applications and system design and development experience. His current role is National FPM Practice Leader. His experience includes BI, Web architecture & design, systems analysis, GUI design and testing, Database modeling and systems analysis, design, and development of Client/Server, Web and Mainframe applications and systems utilizing: Applix TM1 (including TM1 rules, TI, TM1Web and Planning Manager), dynaSight - ArcPlan, ASP, DHTML, XML, IIS, MS Visual Basic and VBA, Visual Studio, PERL, Websuite, MS SQL Server, ORACLE, SYBASE SQL Server, etc. His Responsibilities have included all aspects of Windows and SQL solution development and design including: analysis; GUI (and Web site) design; data modeling; table, screen/form and script development; SQL (and remote stored procedures and triggers) development and testing; test preparation and management and training of programming staff. Other experience includes development of ETL infrastructure such as data transfer automation between mainframe (DB2, Lawson, Great Plains, etc.) systems and client/server SQL server and Web based applications and integration of enterprise applications and data sources. In addition, Mr. Miller has acted as Internet Applications Development Manager responsible for the design, development, QA and delivery of multiple Web Sites including online trading applications, warehouse process control and scheduling systems and administrative and control applications. Mr. Miller also was responsible for the design, development and administration of a Web based financial reporting system for a 450 million dollar organization, reporting directly to the CFO and his executive team. Mr. Miller has also been responsible for managing and directing multiple resources in various management roles including project and team leader, lead developer and applications development director. Specialties Include: Cognos/TM1 Design and Development, Cognos Planning, IBM SPSS and Modeler, OLAP, Visual Basic, SQL Server, Forecasting and Planning; International Application Development, Business Intelligence, Project Development. IBM Certified Developer - Cognos TM1 (perfect score 100% on exam) IBM Certified Business Analyst - Cognos TM1

More from this Author

Follow Us
TwitterLinkedinFacebookYoutubeInstagram